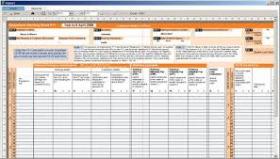
Working Sheets are the best tool, the swiss knife for consultant.
There are 5 main directions of analysis:
- Basic : how to create a new sheet, insert value
- Editing: how to improve data visualization
- Managing: how to treat data
- Analysis: how to use Scenario tool and Pivot table
- Drawing: how to build graphics tools
Pivot Table
The best tool for analyzing data because those can:
- work without formulas
- perform caclulation without thouching data in other sheets
- present results in many resuming ways
The main inner mechanism is the capability of turning rows and columns, so the name 'pivot' (i.e. linchpin). Pivot graphs are also available and there are the corrisponding to pivot tables.
The pivot tables are intended to summarize data, creating indicators, by the mean of logical functions (usually SUM). Creating a pivot sheet, the following should be established:
- Function: which operator to use for summarizing
- Application Area: which columns apply the funztion to
- Crossing: which columns correlate the data to
The pivot tables allow for the use of operators analogous to UNION function in SQL.
